library(tidyverse)
library(vegan)
library(DT)
ants <- read.csv("desertants.csv")Diversity data wrangling for the vegan package
analysis
R
ecology
data wrangling
Tutorial in R for formatting data for analysis in the vegan package
This inaugural blog post documents simple pieces of code I have used again and again when studying insect communities. The vegan package has a suite of tools suitable for community ecology analyses and is my first stop when analyzing a new dataset.
For new users, its functionality can be daunting because many functions require two, very differently formatted dataframes as input. The first is a community data matrix in a wide format. For demonstration, I will be using a dataset of ant morphospecies abundances from Californian arid ecosystems that I collected during a three-week survey Spring 2019.
Introduction
This is what the dataset looks like. It is in 'long' format, meaning each species and its abundance is in one row. A single sample can have multiple rows, one for each species. This is the format I use when working through sample vials IDing insects.
Vegan requires a wide format, where the species are columns and there is only one sample per row. In this case I need to clean the data first, and then converting it into a wide format is straightforward using tidyr.
str(ants)'data.frame': 357 obs. of 14 variables:
$ X : int 1 2 3 4 5 6 7 8 9 10 ...
$ Region : chr "Cuyama" "Cuyama" "Mojave" "Mojave" ...
$ Site : chr "C2" "C1" "M3" "M1" ...
$ Microsite : chr "shrub" "shrub" "ephedra" "larrea" ...
$ Rep : int 26 2 2 2 18 22 26 29 6 6 ...
$ location : chr "ethanol" "ethanol" "ethanol" "pinned" ...
$ Quantity : int 3 1 1 1 1 2 1 6 3 6 ...
$ Order : chr "Hymenoptera" "Hymenoptera" "Hymenoptera" "Hymenoptera" ...
$ Family : chr "Formicidae" "Formicidae" "Formicidae" "Formicidae" ...
$ Subfamily : chr NA NA NA NA ...
$ Genus : chr NA "Pogonomyrmex" NA NA ...
$ Species : logi NA NA NA NA NA NA ...
$ highest.rtu : chr "alate" "alate" "alate" "alate" ...
$ morphospecies: chr "alate NA" "alate NA" "alate NA" "alate NA" ...Wrangle the species dataset
Microsite is the location the traps were placed. I can see from str(ants) that there are errors in the data because there should only be three microsites. Inputting data into excel often introduces invisible blank spaces
#remove the blanks
ants$Microsite <- gsub(" ", "", ants$Microsite)

#replace all instances of the string 'shrub' with 'ephedra'
ants$Microsite <- gsub("shrub", "ephedra", ants$Microsite)

#convert to a factor
ants$Microsite <- as.factor(ants$Microsite)
Next we need a unique sample identifier. I'm using site + microsite + rep.
ants$uniID <- paste(ants$Site, ants$Microsite, ants$Rep)Drop all columns except the sample identifier, species identity and abundance and spread the data.
ants <- ants %>% select(uniID, morphospecies, Quantity)

#aggregrate observations for the same species
#if there are multiple vials for the same rep

ants <- ants %>% group_by(uniID, morphospecies) %>% summarise(Quantity = sum(Quantity))
`summarise()` has grouped output by 'uniID'. You can override using the `.groups` argument.#spread data into wide format
comm <- ants %>% spread(morphospecies, Quantity)
#drop the identifier and any unwanted species.
#In this case I am excluding reproductive alates
#because I couldn't assign them to morphospecies
comm <- ungroup(comm) %>% select(.,-"alate NA", -"ignore NA")
#replace the NAs with zeros
comm[is.na(comm)] <- 0This is what the data looks like in wide format: Sites are rows and species are columns.
Wrangle the environemental dataset
cov <- read.csv("cov.csv")It has far more rows than the community dataset because it is part of a larger project. The column PF specifies if a pitfall trap was placed at that location.
#first remove all the rows without pitfall traps
cov <- filter(cov, PF == "Y")

#create a unique identifier to match the community data row names
cov$uniID <- paste(cov$site, cov$Microsite, cov$ID)
Dealing with sites with no species
How you proceed after this point depends on whether you have samples with zero specimens. This dataset has zeroes and most tutorials ignore that zeroes happen in real datasets.
First, determine which pitfall samples had zero specimens using dplyr's antijoin()
#put the covariate dataset first
zeroes <- anti_join(cov, comm, by = "uniID")
str(zeroes)
'data.frame': 15 obs. of 10 variables:
$ Region : chr "Panoche" "Panoche" "Panoche" "Panoche" ...
$ site : chr "PAN3" "PAN2" "PAN2" "PAN1" ...
$ ID : int 19 6 6 26 30 30 22 29 18 6 ...
$ Microsite: chr "ephedra" "ephedra" "open" "open" ...
$ x : int 280 225 NA NA 270 NA 220 375 160 370 ...
$ y : int 265 200 NA NA 260 NA 210 360 130 255 ...
$ z : int 115 80 NA NA 130 NA 145 185 70 130 ...
$ rdm.cov : int 50 65 8 15 45 35 30 35 8 6 ...
$ PF : chr "Y" "Y" "Y" "Y" ...
$ uniID : chr "PAN3 ephedra 19" "PAN2 ephedra 6" "PAN2 open 6" "PAN1 open 26" ...#15 observations had zero antsAdd the empty samples to the community dataframe and populate with zeroes
zeroes <- select(zeroes, "uniID")
comm <- bind_rows(comm, zeroes)
comm[is.na(comm)] <- 0
Match the order of the two datasets
all.equal(comm$uniID, cov$uniID)[1] "Lengths (157, 156) differ (string compare on first 156)"
[2] "156 string mismatches" #need to reorder them
comm <- comm[match(cov$uniID, comm$uniID),]
all.equal(comm$uniID, cov$uniID)[1] TRUE#drop the unique identifier column from community dataframe
comm <- select(comm, -uniID)Alpha diversity calculations
Calculate abundance, species richness,Shannon & Simpson's index, and evenness and bind these indices to the covariate dataframe for visualization and modelling
cov$abundance <- apply(comm, 1, sum)
#check that the total is what you expect
sum(cov$abundance)
[1] 3769H <- diversity(comm)
simp <- diversity(comm, "simpson")
S <- specnumber(comm)
J <- H/log(S)
cov$H <- H
cov$Simpson <- simp
cov$Species <- S
cov$Even <- JDone!
ggplot(cov, aes(Microsite, Species)) + geom_boxplot() + ylab("Ant Species Richness")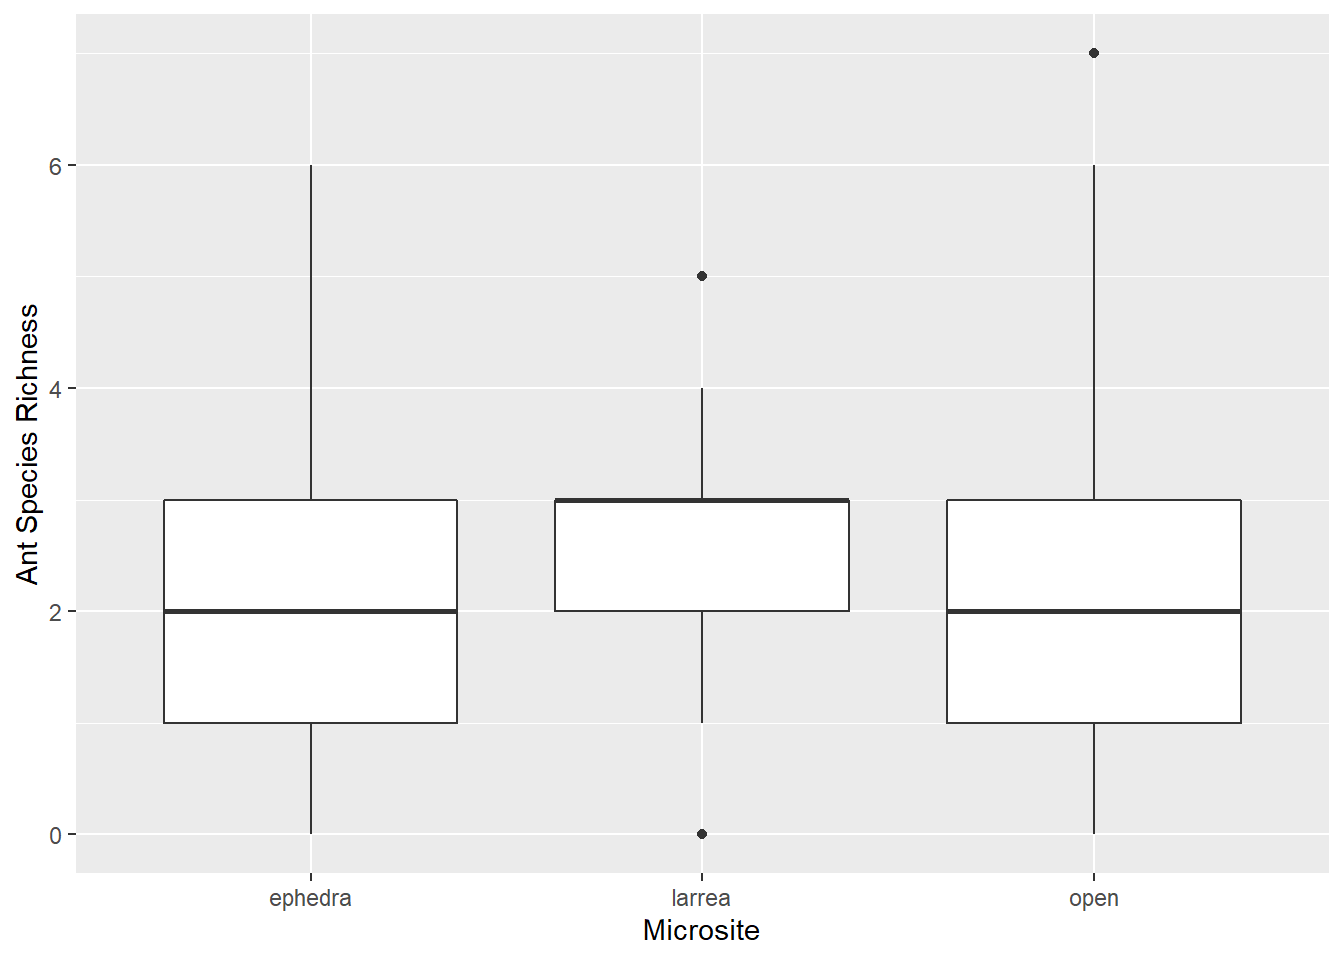
RDA example
comm <- decostand(comm, "hellinger")

p1 <- rda(comm ~ cov$Microsite + cov$rdm.cov)
p1
Call: rda(formula = comm ~ cov$Microsite + cov$rdm.cov)
Inertia Proportion Rank
Total 0.73008 1.00000
Constrained 0.08311 0.11383 3
Unconstrained 0.64697 0.88617 23
Inertia is variance
Eigenvalues for constrained axes:
RDA1 RDA2 RDA3
0.07434 0.00572 0.00305
Eigenvalues for unconstrained axes:
PC1 PC2 PC3 PC4 PC5 PC6 PC7 PC8
0.14910 0.12034 0.07951 0.05873 0.04364 0.03710 0.03314 0.02714
(Showing 8 of 23 unconstrained eigenvalues)anova.cca(p1)Permutation test for rda under reduced model
Permutation: free
Number of permutations: 999
Model: rda(formula = comm ~ cov$Microsite + cov$rdm.cov)
Df Variance F Pr(>F)
Model 3 0.08311 6.5084 0.001 ***
Residual 152 0.64697
---
Signif. codes: 0 '***' 0.001 '**' 0.01 '*' 0.05 '.' 0.1 ' ' 1